👤 This article is for providers. Only provider accounts can access this report.
The Attendee Associations report shows which professional associations your event attendees are affiliated with, broken down by month. Use it to understand which professional bodies your audience represents over time, spot trends in attendance composition, and inform partnership, content, and marketing decisions. Unlike Attendee Analysis — which reflects all of your attendees based on their profiles — this report focuses specifically on the associations represented at your actual events.
Before you begin
- You must be logged in with a provider account.
- For the report to display meaningful data, your account should have at least one event with attendees in the selected time period.
- For background on accessing reports and common filters, see Reports Overview (Providers).
How do I view the Attendee Associations report?
- Sign in to www.ceuevents.com using your provider account credentials.
- Click on the Reports menu.
- Select Attendee Associations.
What the report shows
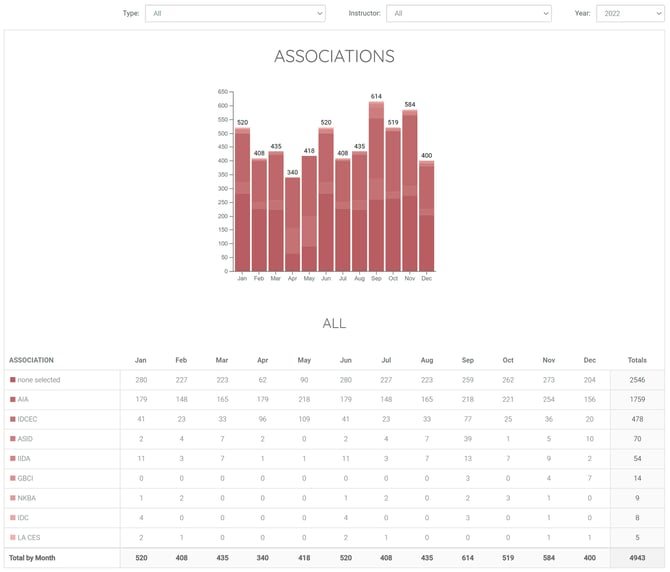
The report displays both a visual chart and a detailed data table:
- Chart — A monthly stacked bar chart showing total attendees per month, color-coded by association.
- Data table — Each association appears on its own row, with monthly columns (Jan through Dec) and a yearly Totals column. A Total by Month row at the bottom sums all associations for each month.
- "None selected" row — Captures attendees who didn't specify an association in their CEU Events profile. A consistently high count here is a signal that attendees are completing the registration process without filling in their professional association — which limits the value of this report.
Common associations represented may include AIA, IDCEC, ASID, IIDA, GBCI, NKBA, IDC, LA CES, and others — depending on the platform's available list and which associations your specific attendees have selected.
What filters are available?
This report supports the following filters:
- Type — In-person or webinar events.
- Instructor — Filter to a specific instructor.
- Year — A specific calendar year.
📝 Note: The data source for this report is event-based, meaning the numbers reflect attendees who participated in events during the selected period. This is different from Attendee Analysis, which is based on attendee account profiles and reflects your full attendee universe regardless of event activity.
What are the best practices for using this report?
- Identify partnership opportunities. Associations with consistently high attendance numbers are strong candidates for partnership, co-marketing, or sponsorship conversations. The fact that their members are showing up at your events is meaningful.
- Compare to Attendee Analysis. If a particular association is strongly represented in your overall attendee base (Attendee Analysis) but underrepresented in actual event attendance (this report), there may be an opportunity to better engage that segment.
- Watch the "None selected" count. A high count here suggests attendees aren't completing their profiles. You may want to remind attendees to fill in their association information so credit reporting and audience analytics work as intended.
- Filter by Instructor for course-design insights. Some instructors may attract audiences from specific associations. Knowing this can help you align course topics with the right presenters.
- Track trends across years. Comparing year-over-year totals for major associations reveals shifts in your audience composition over time.
💡 Tip: When considering a new partnership or accreditation push, run this report filtered by Year to confirm the association's representation is large enough — and growing — to justify the investment.
Troubleshooting
- The report shows no data. Confirm at least one event matching your filters has taken place in the selected year with at least one attendee. Try removing filters to see if data appears.
- An association you'd expect to see isn't listed. This usually means no attendees in the selected period have selected that association in their profile. The association will appear once at least one attendee selects it and attends an event.
- The "none selected" count is unexpectedly high. This indicates a profile-completeness gap, not a report issue. Consider reminding your attendees to fill in their professional association during registration or at sign-in.
- Numbers don't match what you see in Attendee Analysis. This is expected — the two reports use different data sources. This report is event-based (counts attendees at events); Attendee Analysis is account-based (counts all attendee profiles regardless of event activity).