👤 This article is for providers. Looking for the instructor version? See Event Totals by Course (Instructors).
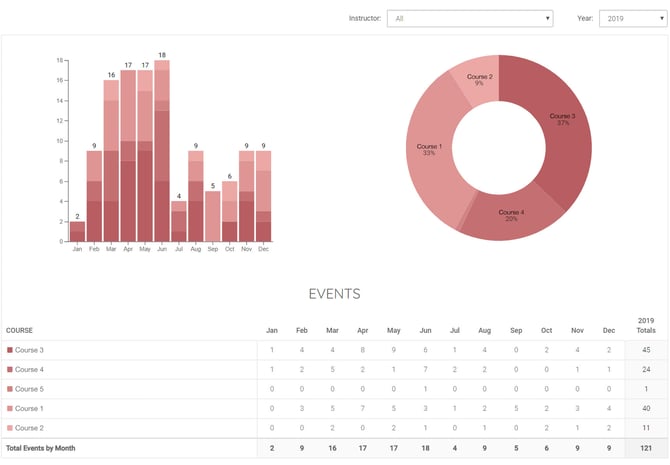
The Event Totals by Course report shows event and attendee totals grouped by individual course, with monthly counts and each course's percentage of your overall totals. Use it to identify your top-performing courses, see which courses drive the most attendance, and spot courses that may need a refresh or retirement. It presents the same underlying data as the Event Totals (Providers) report, broken down by course instead of shown as a single aggregate.
Before you begin
- You must be logged in with a provider account.
- For the report to display meaningful data, your account should have at least one event in the selected time period.
- For background on accessing reports and common filters, see Reports Overview (Providers).
How to view the Event Totals by Course report
- Sign in to www.ceuevents.com using your provider account credentials.
- Click the Reports menu.
- Select Event Totals by Course.
What the report shows
The report is presented in two groups, each broken down by course:
Events by Course
Monthly and total count of events for each course, along with the percentage each course contributed to your overall event volume. Use this to see which courses you're running most often.
Attendees by Course
Monthly and total count of attendees for each course, along with the percentage of total attendees each course attracted. Use this to see which courses are drawing the largest audiences — not always the same as the courses you run most often.
Filters
This report supports the following filters:
- Type — Filter by event format: In-Person or Webinar.
- Instructor — Filter to a specific instructor assigned to your events.
- Year — Filter to a specific calendar year.
Best practices for using this report
- Compare event count to attendee count. A course with a high event count but low attendee count may need promotion or content updates. A course with a low event count but high attendees-per-event has strong appeal — consider running it more often.
- Watch your course mix. If a single course accounts for an overwhelming percentage of your activity, you may want to diversify by promoting other courses in your library.
- Identify retirement candidates. Courses with consistently low event and attendee percentages over multiple years may be ready to retire or replace.
- Pair with Event Totals. Use this report alongside the Event Totals (Providers) report to understand both the overall picture and the course-level breakdown.
💡 Tip: Filter by Year to compare a course's percentage of total activity from one year to the next. A declining percentage may signal it's time to refresh the content, while a rising percentage indicates growing demand.
Troubleshooting
- The report shows no data. Confirm that at least one event matching your current filters has taken place in the selected year. Try clearing all filters to see if data appears with no restrictions applied.
- A course I expected to see is missing. The report only includes courses that have at least one event in the selected year. Courses with no activity in that period will not appear.
- The Instructor filter shows no options. Instructor options are populated from events in your account. If no events have been assigned an instructor, this filter will be empty.