👤 This article is for providers. Only provider accounts can access the Event Totals by Instructor report.
The Event Totals by Instructor report is a provider-level report in CEU Events that shows event and attendee totals grouped by instructor, along with an efficiency percentage (EFF) for each instructor. Use it to evaluate your team's overall performance, identify top contributors worth recognizing, and spot instructors who could benefit from additional support or training. This report pairs naturally with Event Totals (Providers) for overall context and Event Totals by Course (Providers) for course-level detail.
Before you begin
- You must be logged in with a provider account.
- For the report to display meaningful data, your account should have at least one event in the selected time period.
- For background on accessing reports and common filters, see Reports Overview (Providers).
How to view the Event Totals by Instructor report
- Sign in to www.ceuevents.com using your provider account credentials.
- Click the Reports menu.
- Select Event Totals by Instructor.
What the report shows
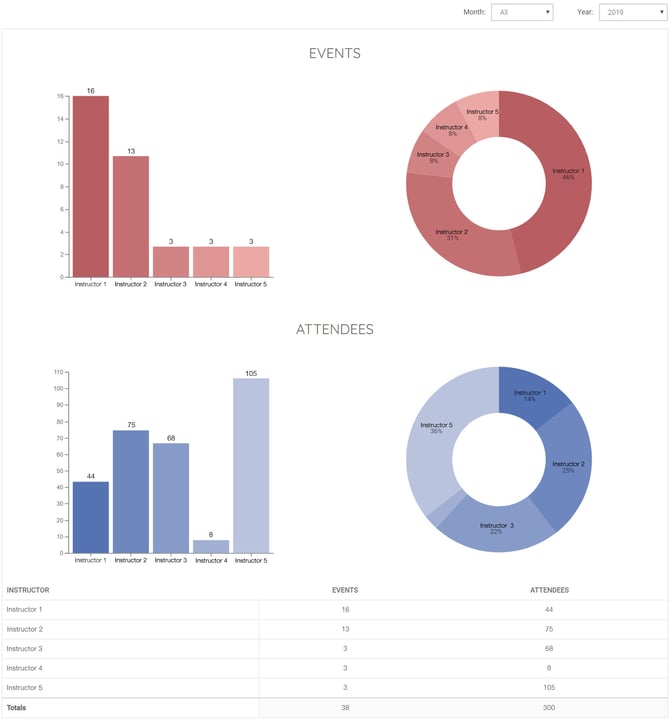
The report is organized into three sections, each broken down by instructor with monthly totals:
Events
Number and percentage of events conducted per instructor. The percentage shows each instructor's share of total events in the selected time period.
Attendees
Number and percentage of attendees per instructor. The percentage shows each instructor's share of total attendees — useful for spotting instructors who attract larger audiences regardless of how many events they run.
EFF (Efficiency)
EFF (Efficiency) is a score from 0–100% that measures how consistently an instructor follows best practices: creating events before the event date, pre-registering attendees, and minimizing manual attendee data entry after the event. We recommend a baseline of 85%. Instructors falling consistently below that benchmark are good candidates for coaching on event creation timing, attendee pre-registration habits, and reducing manual after-event data entry.
Filters
This report supports the following filters:
- Type — In-person or webinar events.
- Year — A specific calendar year.
📝 Note: This report does not include an Instructor filter, since the report is already grouped by instructor. To focus on a single instructor's activity over time, look at their row across multiple years.
Best practices for using this report
- Use EFF as your starting point. Sort or scan by EFF to quickly spot instructors performing above and below the 85% baseline. High-EFF instructors are good models — consider sharing their habits with the team.
- Compare event volume to attendee volume. An instructor with a high event share but low attendee share may be running smaller events; the inverse may indicate they're drawing big audiences but not running often.
- Coach below-baseline instructors specifically. Pair this report with Event Totals (Providers) to see whether the issue is event creation timing, after-event attendee registration, or both.
- Recognize top performers. Public acknowledgement of consistently high-EFF instructors reinforces best practices across your team.
💡 Tip: Run this report at the end of each quarter to make instructor coaching conversations data-informed rather than anecdotal.
Troubleshooting
- An instructor you'd expect to see isn't listed. Confirm the instructor's status is Active and that they have at least one event in the selected time period.
- An instructor's EFF seems lower than expected. EFF reflects best-practice habits like creating events before the event date, pre-registering attendees, and keeping manual entry of attendee information after the event to a minimum. Review the Created After Event Date and Registered After Event Date metrics in Event Totals (Providers) for that instructor to identify what's driving the score.